Loss Aversion and the Cost of Checking Your Portfolio
The combination of loss aversion, negatively skewed equity returns, and high observation frequency turns a positive-expectation investment into a psychologically negative experience.
Most people check their long-term investments too often. The combination of loss aversion — where losses feel roughly twice as painful as equivalent gains feel good — and the negatively skewed return distribution of equity markets means that daily observation turns a positive-expectation investment into a psychologically negative experience. Even professional traders are not immune to this1.
Loss Aversion
Humans feel the pain of losses more intensely than the pleasure of equivalent gains — a trait known as loss aversion2.
Take a coin toss where you win $10 if you guess correctly and lose $10 if you don’t. Loss aversion implies that you’ll feel more emotional pain from losing $10 than comparative joy from winning $10. For you to be indifferent between the two outcomes, you might need to win $20 for every $10 you could lose. This lopsided impact can discourage holding investments for the long run, even when the odds are in your favour.
Risk Premiums and Negative Skew
Long-term investments — pensions, retirement accounts, passive equity allocations — are often based on risk premiums that reliably compensate investors over long horizons. But like every investment, they fluctuate and encounter periods of underperformance. Worse, the “shape” of positive and negative performance is usually asymmetric.
Most commonly, the daily returns in equity-heavy portfolios are negatively skewed. Using simple illustrative figures:
- On 51% of days, you gain $10
- On 48% of days, you lose $10.10
- On 1% of days, you lose $20
Over a long timeframe, this averages to roughly $0.05 per day — positive expectation. But if you check your portfolio daily, you don’t experience the long-run average. You experience the lopsided, negatively skewed daily distribution. And because of loss aversion, the losing days hit harder than the winning days feel good.
The Interaction Effect
If we define loss aversion as a conservative 10% asymmetry — you feel losses 10% more intensely than equivalent gains3 — the daily experience becomes:
- On winning days: you gain $5.10
- On losing days: you lose $5.05, but it feels like $5.55
When you observe each daily loss individually, it’s difficult to rationalise that you’re making money over the long term, even if the figures speak for themselves objectively. This is especially true during risk-asset selloffs when you experience day after day of losses.
Here’s what it “feels” like to own Vanguard’s Total Stock Market ETF (VTI) over a long period, with this 10% loss aversion asymmetry, depending on whether you check daily, weekly, or monthly:
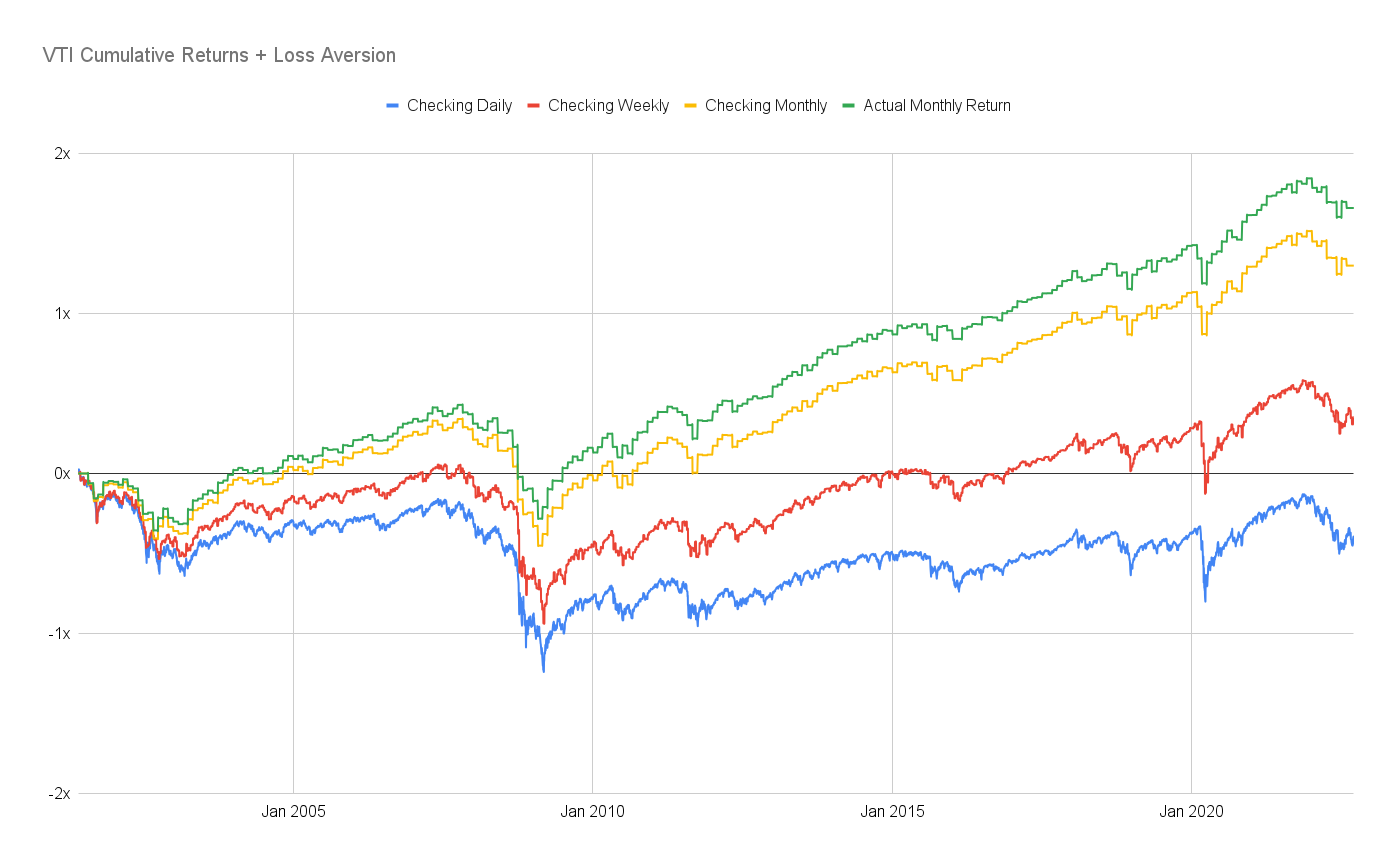
This is one of the broadest, most diversified equity portfolios available — among the best ways to harvest the equity risk premium.
But there’s a compounding effect: consecutive losses amplify loss aversion further. If a second consecutive loss increases your aversion to 1.21:
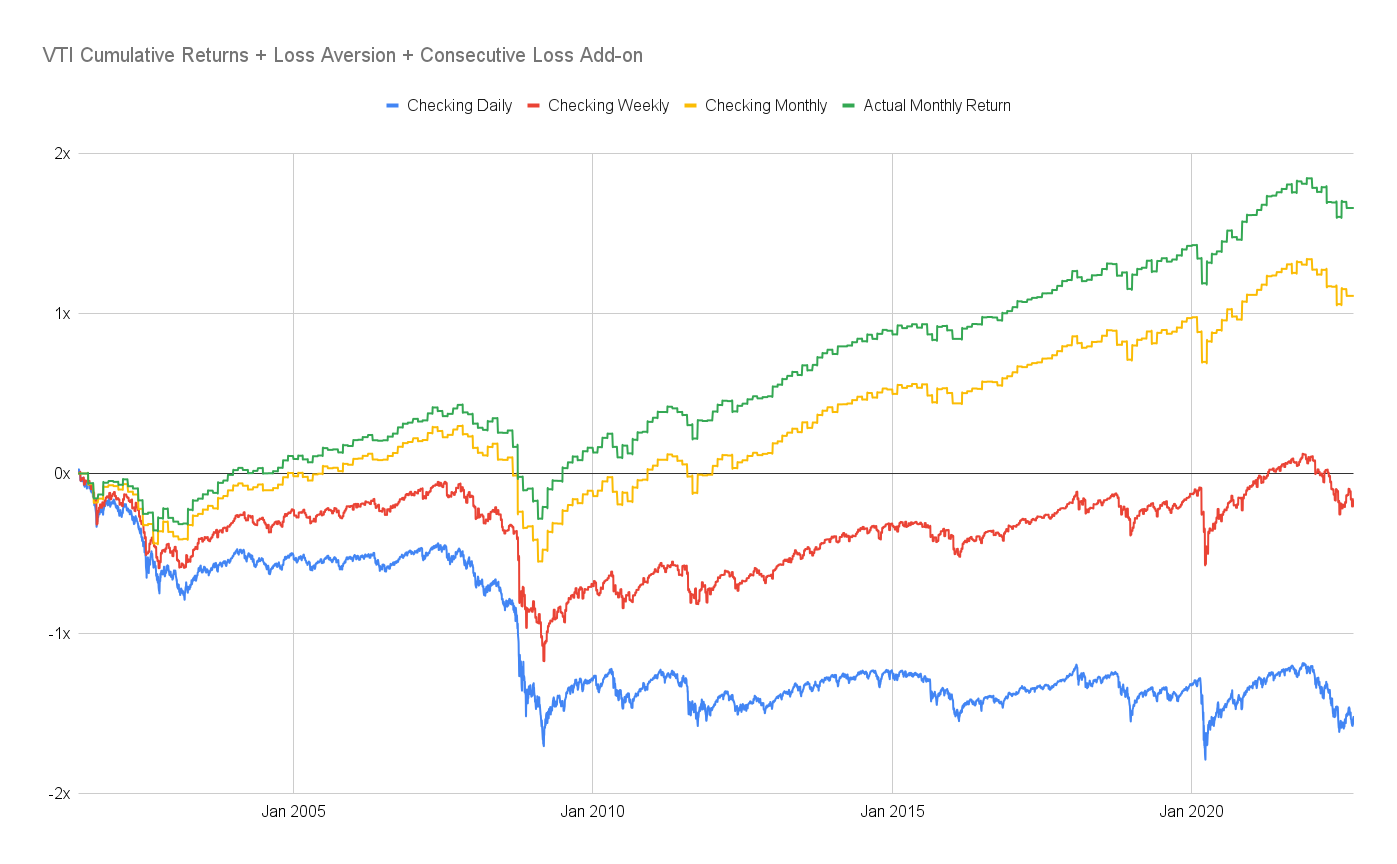
Even with one of the most reliable risk premiums on the planet, accessed through the cheapest and most broadly diversified vehicle available, over a long period — using this naively simple loss aversion model — the only palatable observation frequency is monthly. Daily and weekly feel like you’re losing money.
Implications
If your risk is managed and your asset allocation is where you want it, let the portfolio do its work. If you rebalance quarterly, try to only look at it at those quarterly events and not in between. Observation frequency is a free parameter. Set it to match your rebalancing frequency, not your anxiety.
Footnotes
-
Haigh, Michael S., and John A. List. “Do Professional Traders Exhibit Myopic Loss Aversion? An Experimental Analysis.” The Journal of Finance 60, no. 1 (2005): 523–34. JSTOR. ↩
-
Kahneman, Daniel, and Amos Tversky. “Prospect Theory: An Analysis of Decision under Risk.” Econometrica 47, no. 2 (1979): 263–91. DOI. ↩
-
The original Kahneman-Tversky estimate is closer to 2:1 — losses feel roughly twice as intense as equivalent gains. The 10% figure used here is deliberately conservative: the point of the exercise is to show that even a mild asymmetry, combined with negative skew and high observation frequency, produces a psychologically negative experience. Using the more realistic 2x figure would make the effect dramatically more severe and the argument quantitatively stronger — but the qualitative conclusion about observation frequency is the same either way. ↩